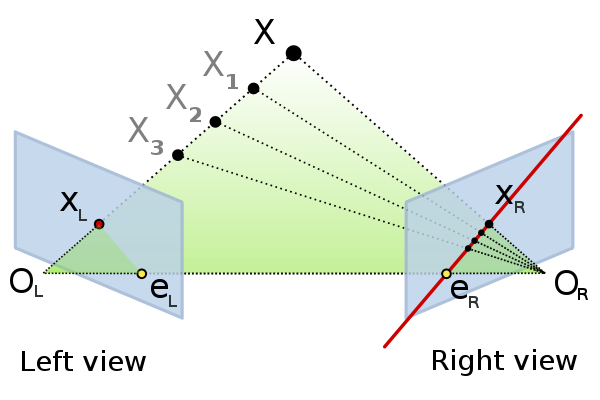
Drawing epipolar lines in OpenCV is not hard but it requires a sufficient amount of code. Here is a out-of-the-box function for your convenience which only needs the fundamental matrix and the matching points. And it even has an option to exclude outliers during drawing!
#include <opencv2/core/core.hpp>
#include <opencv2/highgui/highgui.hpp>
#include <opencv2/calib3d/calib3d.hpp>
#include <opencv2/imgproc/imgproc.hpp>
/**
 * \brief	Compute and draw the epipolar lines in two images
 *			associated to each other by a fundamental matrix
 *
 * \param title			Title of the window to display
 * \param F					Fundamental matrix
 * \param img1			First image
 * \param img2			Second image
 * \param points1		Set of points in the first image
 * \param points2		Set of points in the second image matching to the first set
 * \param inlierDistance			Points with a high distance to the epipolar lines are
 *								not displayed. If it is negative, all points are displayed
 **/
template <typename T1, typename T2>
static void drawEpipolarLines(const std::string& title, const cv::Matx<T1,3,3> F,
							  const cv::Mat& img1, const cv::Mat& img2,
							  const std::vector<cv::Point_<T2>> points1,
							  const std::vector<cv::Point_<T2>> points2,
							  const float inlierDistance = -1)
{
	CV_Assert(img1.size() == img2.size() && img1.type() == img2.type());
	cv::Mat outImg(img1.rows, img1.cols*2, CV_8UC3);
	cv::Rect rect1(0,0, img1.cols, img1.rows);
	cv::Rect rect2(img1.cols, 0, img1.cols, img1.rows);
	/*
	 * Allow color drawing
	 */
	if (img1.type() == CV_8U)
	{
		cv::cvtColor(img1, outImg(rect1), CV_GRAY2BGR);
		cv::cvtColor(img2, outImg(rect2), CV_GRAY2BGR);
	}
	else
	{
		img1.copyTo(outImg(rect1));
		img2.copyTo(outImg(rect2));
	}
	std::vector<cv::Vec<T2,3>> epilines1, epilines2;
	cv::computeCorrespondEpilines(points1, 1, F, epilines1); //Index starts with 1
	cv::computeCorrespondEpilines(points2, 2, F, epilines2);

	CV_Assert(points1.size() == points2.size() &&
			  points2.size() == epilines1.size() &&
			  epilines1.size() == epilines2.size());

	cv::RNG rng(0);
	for(size_t i=0; i<points1.size(); i++)
	{
		if(inlierDistance > 0)
		{
			if(distancePointLine(points1[i], epilines2[i]) > inlierDistance ||
				distancePointLine(points2[i], epilines1[i]) > inlierDistance)
			{
				//The point match is no inlier
				continue;
			}
		}
		/*
		 * Epipolar lines of the 1st point set are drawn in the 2nd image and vice-versa
		 */
		cv::Scalar color(rng(256),rng(256),rng(256));

		cv::line(outImg(rect2),
			cv::Point(0,-epilines1[i][2]/epilines1[i][1]),
			cv::Point(img1.cols,-(epilines1[i][2]+epilines1[i][0]*img1.cols)/epilines1[i][1]),
			color);
		cv::circle(outImg(rect1), points1[i], 3, color, -1, CV_AA);

		cv::line(outImg(rect1),
			cv::Point(0,-epilines2[i][2]/epilines2[i][1]),
			cv::Point(img2.cols,-(epilines2[i][2]+epilines2[i][0]*img2.cols)/epilines2[i][1]),
			color);
		cv::circle(outImg(rect2), points2[i], 3, color, -1, CV_AA);
	}
	cv::imshow(title, outImg);
	cv::waitKey(1);
}

template <typename T>
static float distancePointLine(const cv::Point_<T> point, const cv::Vec<T,3>& line)
{
	//Line is given as a*x + b*y + c = 0
	return std::fabsf(line(0)*point.x + line(1)*point.y + line(2))
			/ std::sqrt(line(0)*line(0)+line(1)*line(1));
}


Thanks! 😀
Hello, May I ask why the second point doing like this.
I give this two points (0, -c/b) and (-c/a, 0) to draw the line. Assume the line equation is ax+by+c = 0.
But it’s wrong.
cv::Point(img2.cols,-(epilines2[i][2]+epilines2[i][0]*img2.cols)/epilines2[i][1])